Mortgage lead conversion rate benchmarks range from under 1% to 15% depending on what you bought. Any single number covering that range is describing nothing.
Why published benchmarks do not help you? The published averages blend lead types that behave nothing alike. Aged records and rate table leads are not the same product. Average them and you get a number about neither.
What the Published Numbers Actually Say
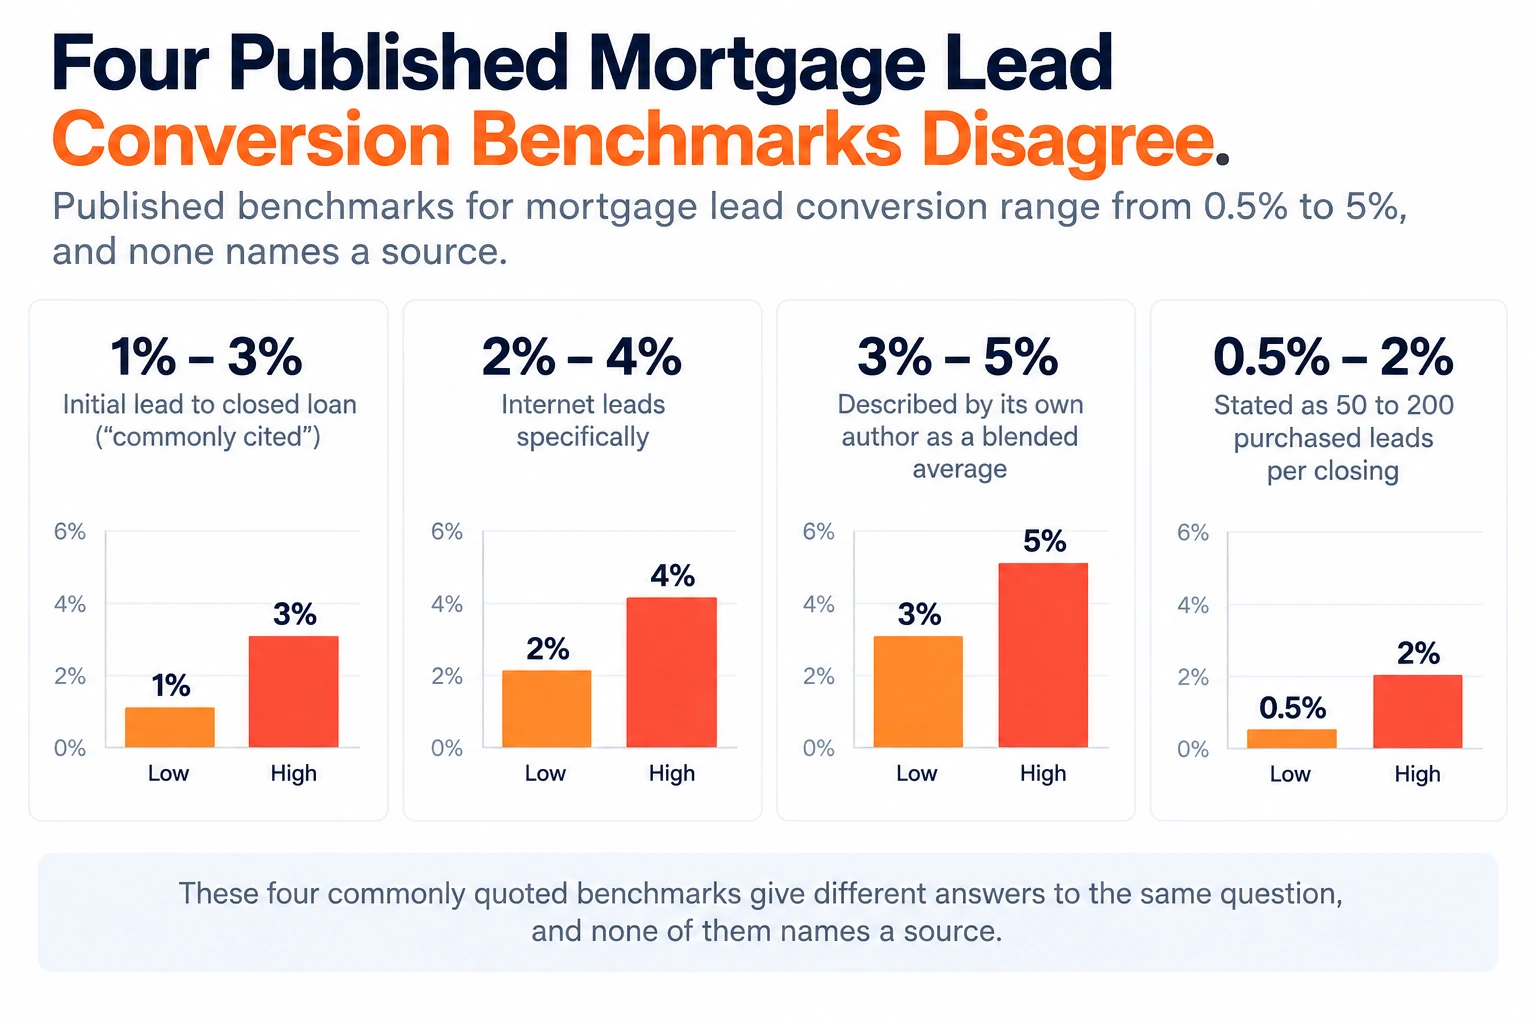
Four sources, four answers, same question. These are the conversion benchmarks for mortgage leads you will find quoted everywhere.
Published range
What it claims to measure
1 to 3%
Initial lead to closed loan, “commonly cited”
2 to 4%
Internet leads specifically
3 to 5%
Described by its own author as a blended average
0.5 to 2%
Stated as 50 to 200 purchased leads per closing
None of them names a source. One page ranking on this query is publishing real estate agent data rather than mortgage data.
They are not contradicting each other. They are measuring different populations and none of them says which.
Mortgage Lead Conversion Rate Benchmarks by Lead Type, in Practice
Here is what a shop with a working system should expect. These are my numbers from 23 years of running campaigns, not a published study. I would rather say that than dress them up.
Lead type
Expect
Why
Aged
Under 1%
The easy ones already closed while they were real-time
Semi-exclusive
1 to 3%
Exclusivity buys the first conversation, not the outcome
Exclusive
1 to 3%
Performs about the same as semi-exclusive
Rate table
Around 8%
The borrower picked your rate and expects your call
Direct mail inbound calls
10 to 15%
You targeted people you were confident had benefit
Read the spread. The best lead type converts more than ten times the worst. That is why a blended industry average is useless for planning.
One caveat that matters more than the numbers. Every figure above assumes a system works the lead. Buying a rate table lead does not produce 8%. A rate table lead plus call flows, drip campaigns, and distribution that actually routes it produces 8%.
Two shops buying identical inventory produce different results, and the inventory was never the variable.
Three things account for most of that gap.
Call flow. Whether the first attempt happens in minutes or hours. And whether the officer knows what to say when the borrower opens with a rate question.
Drip. Whether a lead that went unanswered on day one gets worked again on day four, day nine, and day twenty. Or forgotten in a queue.
Distribution. Whether the record reaches somebody licensed, available, and expecting it, or sits unassigned while the team decides whose it is.
Miss any of the three and your rate table leads convert like aged records. You will conclude the source was bad. You will be wrong.
Direct Mail and the Answer Rate Problem
Direct mail converts highest and fails most often, for the same reason.
It converts because you picked the borrowers. You know the loan amount and the rate they are carrying. You know there is benefit before you mail anything. Nobody buying internet leads has that.
It fails because nobody picks up.
The old saying: if you are not missing calls, you are not sending enough mail. That is true and it is only half of it. Too many missed calls kills the campaign, because you paid for the mail whether or not anyone answered the phone.
So the number to watch on a mail campaign is not conversion. It is answer rate. A campaign converting at 12% on the calls you answered is worthless if you answered a third of them.
That makes direct mail a staffing decision as much as a marketing one.
Work the math before the drop. Mail 10,000 pieces at a 1% call rate and that is 100 inbound calls. They arrive unevenly across two weeks, weighted toward the first three days. Whoever is answering has to be available then, not on a loan file.
The failure I have watched most is a campaign that worked and a shop that could not staff it. The calls came, half went to voicemail, and the campaign got blamed for a coverage problem.
That also means mail and internet leads compete for the same phones. Running both without adding capacity means one of them gets worse.
Conversion Rate Is One of Three Numbers
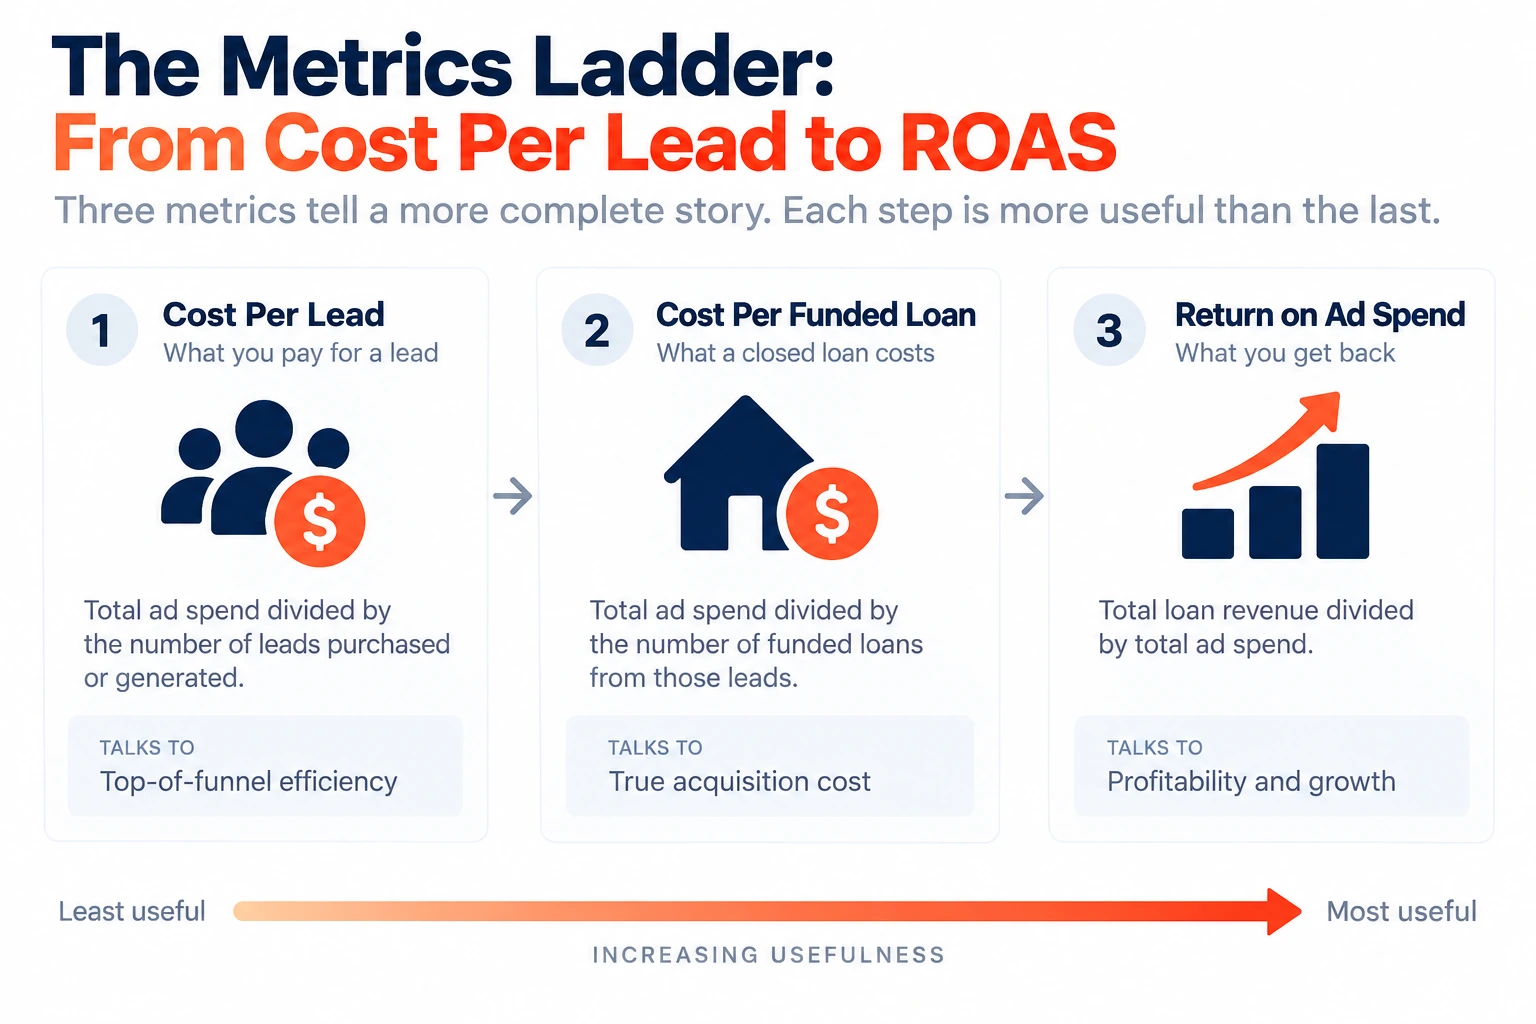
Most shops track the least useful of the three and make decisions on it.
Cost per lead. The most tracked and the worst. You do not get paid on leads. A cheaper lead that never funds costs more than an expensive one that does.
Cost per funded loan. Better, and still incomplete. It tells you what you paid for a loan and nothing about whether that loan was worth it. A cost per funded loan that looks reasonable loses money against a low average revenue per loan.
Return on ad spend. What the channel produced in revenue against what you spent to get it. Return on ad spend mortgage teams should target is the whole point of this section.
That is the number that tells you whether a channel works. My operating target has always been ad spend under 20 to 25% of the revenue that channel generated. Above that and the channel is buying you volume rather than profit.
Run It Once and You Will Never Track Cost Per Lead Again
Work a real channel through it.
Buy 100 rate table leads at $150 each. That is $15,000. Convert at 9% and you funded nine loans. At $8,000 average revenue per loan, that channel produced $72,000.
Your ad spend was 20.8% of the revenue it generated. A 4.8x return, and cost per funded loan came in at $1,667.
That channel works. Now find out how close to the edge it is.
Three things can break it and only one is the lead.
Revenue per loan drops to $6,700 and you are at 25%. Nothing about the leads changed.
Lead price rises to $180 and you are at 25%. Same conversion, same revenue.
Conversion slips to 7.5% and you are at 25%. Two lost loans out of nine.
Each of those is a $25 move or a point and a half. None of them shows up in a conversion rate. Two have nothing to do with the lead source at all.
That is also why cost per funded loan is not enough. $1,667 reads well on any report. Whether it is good depends entirely on a number that is not on that report.
The Word “Pull-Through” Means Two Different Things
Worth catching, because it produces arguments where nobody is wrong.
In secondary marketing, pull-through is funded volume divided by locked volume. It measures the probability that a locked loan closes, and it exists for hedging.
In a sales conversation, people usually mean application to close.
Those start at different points and cover different populations. A capital markets team quoting pull-through and a branch manager quoting pull-through are not discussing the same metric. Ask which one before comparing anything.
What to Measure Weekly
Four rates, tracked by source and never blended. Those are the lead conversion rates by source worth reviewing.
Contact rate. Live two-way conversations divided by leads
Application rate. Applications divided by contacts
Funded rate. Funded loans divided by applications
Return on ad spend. Revenue divided by spend, by channel
Those four in sequence tell you where a source breaks rather than whether it works.
The definitions matter more than they sound. Contact rate and connect rate are different numbers and get used interchangeably, which makes comparison meaningless. Our mortgage CRM statistics page carries the full taxonomy with sourced third-party figures.
Building a Baseline You Can Trust
Ninety days, by source, tracked separately.
The window is set by the slowest rate in the sequence. Contact rate reads in a week. Funded rate needs a full cycle, so anything shorter measures the top of the funnel and guesses at the bottom.
Blended tells you how you did. By source tells you what to buy next month.
Enough volume per source to mean something. Ten leads from a vendor is an anecdote, not a test. One closing swings the percentage by ten points.
None of that works without lead source captured on arrival. Mortgage lead distribution software that stamps the source and logs every attempt is what makes the math possible later. Reconstruct it from memory and you get a story.
When Your Number Is Below the Range
The useful question is not whether you are below. It is which rate is below.
Work the four in order and the answer is usually obvious. A weak contact rate is a response problem, and no lead source fixes it. A strong contact rate with a weak application rate is a conversation problem, which is call flow and scripting. A strong application rate with a weak funded rate is a qualification problem. You are taking applications from people who were never going to close.
Each of those has a different fix and they are not interchangeable. Buying better leads solves exactly one of the three, and only when the source was genuinely the problem.
Mortgage lead conversion rate benchmarks are useful for one thing: telling you which of those three to look at first.
One Figure We Left Out
A 391% conversion lift from responding in one minute rather than five circulates widely on this subject.
We do not use it. Tracking it down, the same figure appears with four different comparators depending on who is quoting it. At least three versions are wrong and there is no way to tell which one is not.
We compared platforms on what they let you measure in our mortgage CRM comparison.
Frequently Asked Questions
What is a good mortgage lead conversion rate?+There is no single answer, because it depends entirely on the lead type. Aged records convert under 1%. Exclusive and semi-exclusive leads run 1 to 3%. Rate table leads run around 8%, and direct mail inbound calls can reach 10 to 15%.
Those are my figures from running campaigns, not a published study. Compare yourself to the right lead type or the number tells you nothing.
Why do published mortgage lead conversion benchmarks disagree?+Because they blend lead types that behave nothing alike and none of them says which types are in the average. Four widely cited ranges on this subject span 0.5% to 5%, and none names a source.
MBA also reports that pull-through of closings to applications has declined over four years. Older benchmarks measure a funnel that has since changed.
Should I track cost per lead or cost per funded loan?+Neither on its own. Cost per lead is the worst of the three common metrics because you do not get paid on leads. Cost per funded loan is better and still incomplete. A reasonable-looking figure loses money against a low average revenue per loan.
Return on ad spend is the one that answers the question. Keep ad spend under 20 to 25% of the revenue that channel produced.
How long does it take to establish a reliable conversion baseline?+Ninety days by source, with enough volume per source to survive one closing swinging the percentage. A shorter window measures the top of the funnel and guesses at the bottom.
Track it by source rather than blended. A blended number tells you how you did. A number by source tells you what to buy next month.
Kevin Benner is the Chief Revenue Officer at Shape Software, where he leads revenue, marketing, and customer growth. He brings over 23 years of experience in mortgage lead generation and sales technology.
Mortgage lead management software decides who gets a lead and moves it from new lead to close. A CRM manages the relationship around it: partners, campaigns and past customers. They are two different services. Most mortgage sales and marketing platforms do one or the other, and very few do both. Lead management and CRM handle […]
Ask a shop how they nurture mortgage leads and you get a sequence. Ask when a lead leaves that sequence and the room goes quiet. That is the whole problem. Nurture gets built as a destination rather than a state with edges, so leads fall in and never come out. The list grows, engagement falls, […]
Lead distribution decides three things. Who gets the lead, how fast they get it, and what happens if they do nothing with it. Most software comparisons stop at the first one. The other two are where the money is. This page is about routing inside your own shop. If you came looking for ping-post, it […]