How to Manage Loan Officers: A Branch Playbook
How to manage loan officers comes down to one problem before any of the others. You cannot coach what you cannot see.
Most branch managers know who complains loudest, who answers messages fastest, and who closed last month. Almost none of them know who stopped dialing three weeks ago. That is the one worth knowing, because it is the only one you could still do something about.
Managing loan officers is not mainly a motivation problem or a compensation problem. It is a visibility problem, and everything below follows from that.
The Job Got Harder and the Headcount Hid It
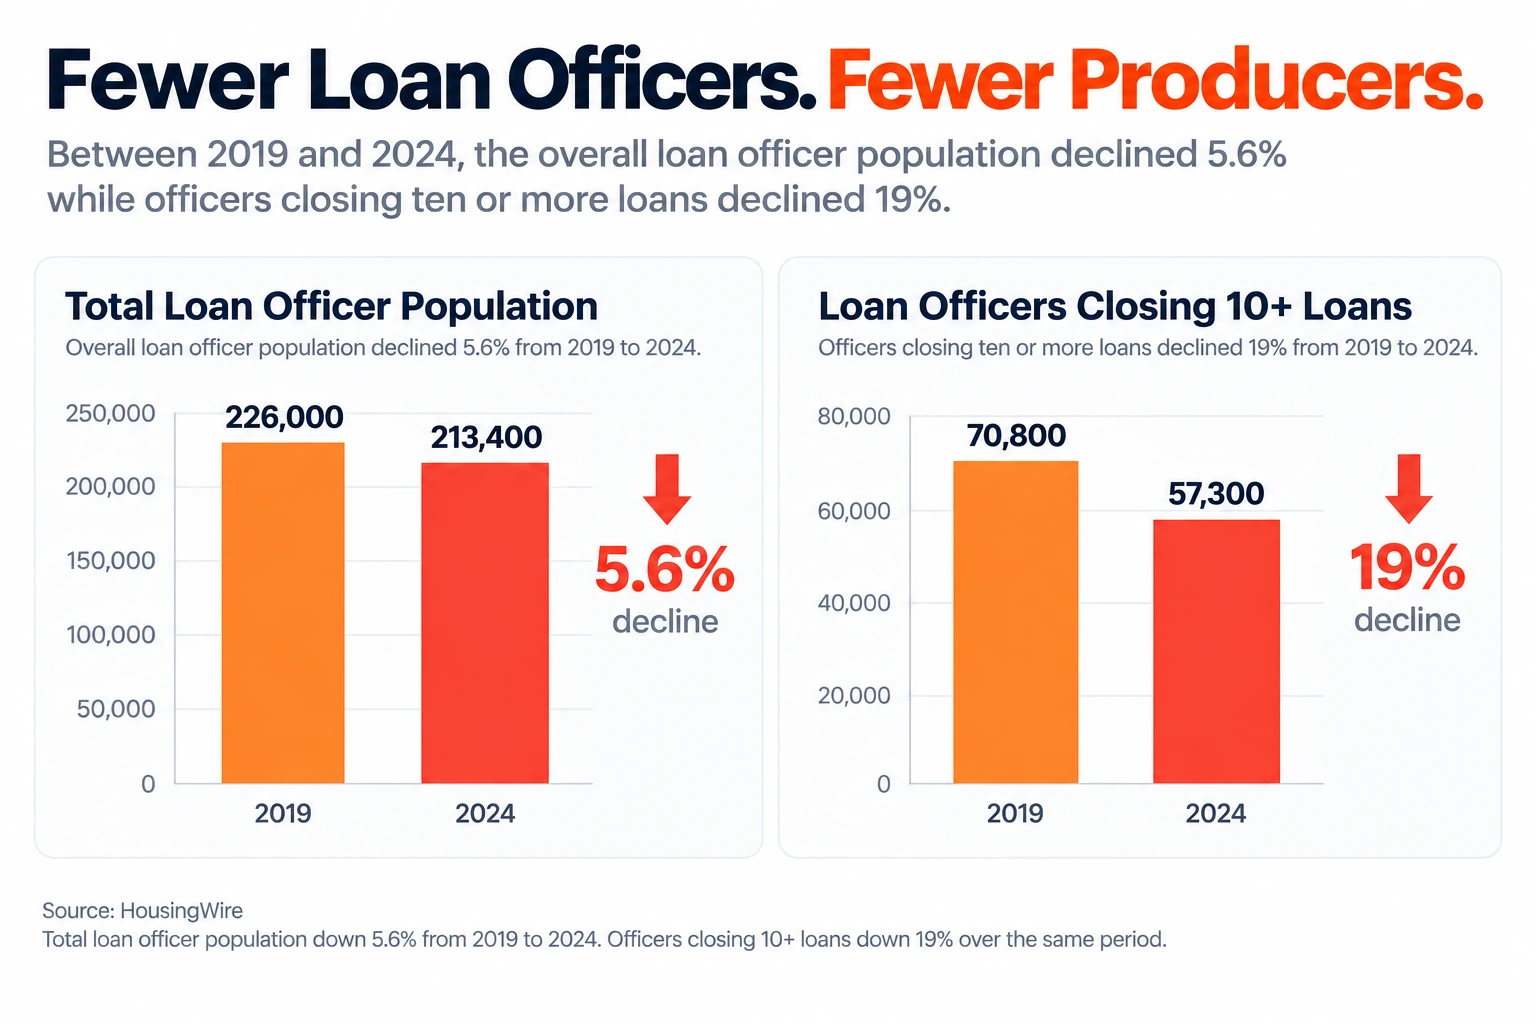
Between 2019 and 2024 the overall loan officer population dropped 5.6%. Over the same period, the number closing five to nine loans dropped 14%. The number closing ten or more dropped 19%.
Read those together. The seats are still filled. Fewer of the people in them produce.
That is the manager’s actual problem in one statistic. A roster that looks the same as it did five years ago contains fewer real producers. The gap between a managed team and an unmanaged one is wider than it used to be.
One caution on the numbers you will see quoted. The widely circulated collapse in loan officer counts compares two different things. The 2020 figure counted licenses issued, so an officer licensed in five states counted five times. Later figures count unique individuals. Comparing them produces a crash that did not happen.
How to Manage Loan Officers by the Numbers That Move First
Not volume. Volume is a lag measure, and by the time it moves the quarter is over.
Loan officer performance management runs on leading indicators, meaning the ones a manager can act on inside the week:
- Attempts per opportunity
- Time to first contact
- Contact rate, meaning live two-way conversations
- Credit pulls
- Applications taken
Those move first, they move because of behavior, and behavior is the only thing a manager influences directly.
Attempts also depend on a lead reaching an available officer to begin with, which is a distribution question as much as a behavior one. How new leads route and how neglected ones get recovered is covered in round robin versus shark tank lead distribution.
Pick three and hold them. Eleven metrics is a scorecard nobody reads, including you. Three numbers reviewed every week beat eleven reviewed quarterly.
The harder part is that most of those numbers do not exist unless the system captures them. Attempts per opportunity is not a number anyone reports from memory. Asking an officer how many times they called is asking them to grade themselves.
Platforms differ more on this than on anything in a feature list. We ranked them on what a manager can actually see in our mortgage CRM comparison.
The Weekly One-on-One
The most useful meeting a branch manager mortgage teams run, and most run it as a status update.
Fifteen minutes, three parts.
Numbers first, from the system. Not from memory and not from the officer’s recollection. Pull the three metrics before the meeting starts so nobody is reconstructing the week.
One thing to fix. Not five. Pick the number that is furthest off and work only on that.
A commitment with a date. What they will do, by when. Written down, reviewed next week.
What ruins it: opening with “how’s it going?” That invites a story, and a story is what an officer offers when the numbers are bad. You will spend twelve of your fifteen minutes on market conditions.
Ramp Time and the First Ninety Days
A new officer who is not producing at ninety days is usually a manager problem rather than a hiring problem.
The pattern is consistent. Week one goes into paperwork and systems. Weeks two through four go into shadowing, if anyone remembers to schedule it. Then the officer is on their own with a CRM they half understand and a pipeline of nothing.
Week one should establish three things. How leads arrive. What the activity standard is. Which numbers get reviewed weekly. Those are habits, and habits set in week one are the ones that hold.
By thirty days you should see activity, not production. By sixty, applications. By ninety, closings in the pipeline. An officer with no activity at thirty days is not ramping slowly. They are not ramping.
Loan Officer Accountability Without Micromanagement
The hardest part of the job, and the reason a lot of managers avoid the numbers entirely.
Here is the distinction that resolves it. Hold officers to activity they control, not outcomes they do not.
Nobody controls whether a borrower answers the phone. Everybody controls whether they dialed. Nobody controls whether a file closes. Everybody controls whether they called the borrower back on Thursday like they said they would.
An activity standard is a commitment. An outcome standard is a wish with consequences attached, and officers know the difference immediately.
That is also why the visibility question matters more than the management style question. A manager who can see attempts can hold an activity standard without hovering. A manager who cannot see attempts has two options: trust, or ask. Asking every day is micromanagement. Trusting without data is how a producer goes quiet for a month.
Managing What You Cannot See
Most loan officers are remote now, at least part of the week. Which means the informal management that used to work does not.
Walking the floor was a real management tool. You could hear who was on the phone. You knew who came in early. None of that survives a distributed team, and most branches never replaced it with anything.
What replaces it is the system, and only the system. If activity is not captured on the record, remote management becomes trust plus hope.
Three questions worth asking about your own platform:
- Can you see attempts per opportunity by officer, without asking anyone
- Does the record show what was actually said, or only that something happened
- Can you tell who stopped working their pipeline, before production drops
If the answer to the third is no, you find out when the month closes. That is sixty days after the behavior changed.
Comp, Contests, and What Actually Moves Numbers
Compensation is the most cited reason officers leave and rarely the real one.
Part of that is because income in this business swings with the market rather than the employer. STRATMOR’s Compensation Connection Study puts retail LO commissions at 92 to 103 basis points of production, steady across years. Average annual income peaked above $170,000 in 2020 and 2021, then fell to $91,000 in 2022 as volume dropped.
Consumer direct was worse. Commissions dropped from over 60 basis points to 48. Average income went from $179,000 in 2021 to $59,000 in 2022. A 67% decline.
Basis points held. Income halved. Nothing an employer did caused that, and nothing a new employer would have fixed.
So when an officer says they are leaving for comp, the useful question is what changed. Usually the answer is lead flow, support, or the feeling that nobody noticed they were struggling.
On contests. They move short-term activity and they rarely change habits. A contest that runs two weeks produces two weeks of dialing. Useful for a specific push, not a substitute for a standard.
Retention, and What Turnover Actually Looks Like
Loan officer turnover is high, cyclical, and better documented than most people realize.
MBA and STRATMOR have tracked it through their Peer Group Roundtable Program since 1998. From 2002 to 2020 the retail LO turnover rate averaged 38%. It hit a survey low of 21% in 2020, the year volume set a record at $3.8 trillion. The second-lowest year was 2003, at 31%, which was the prior record volume year.
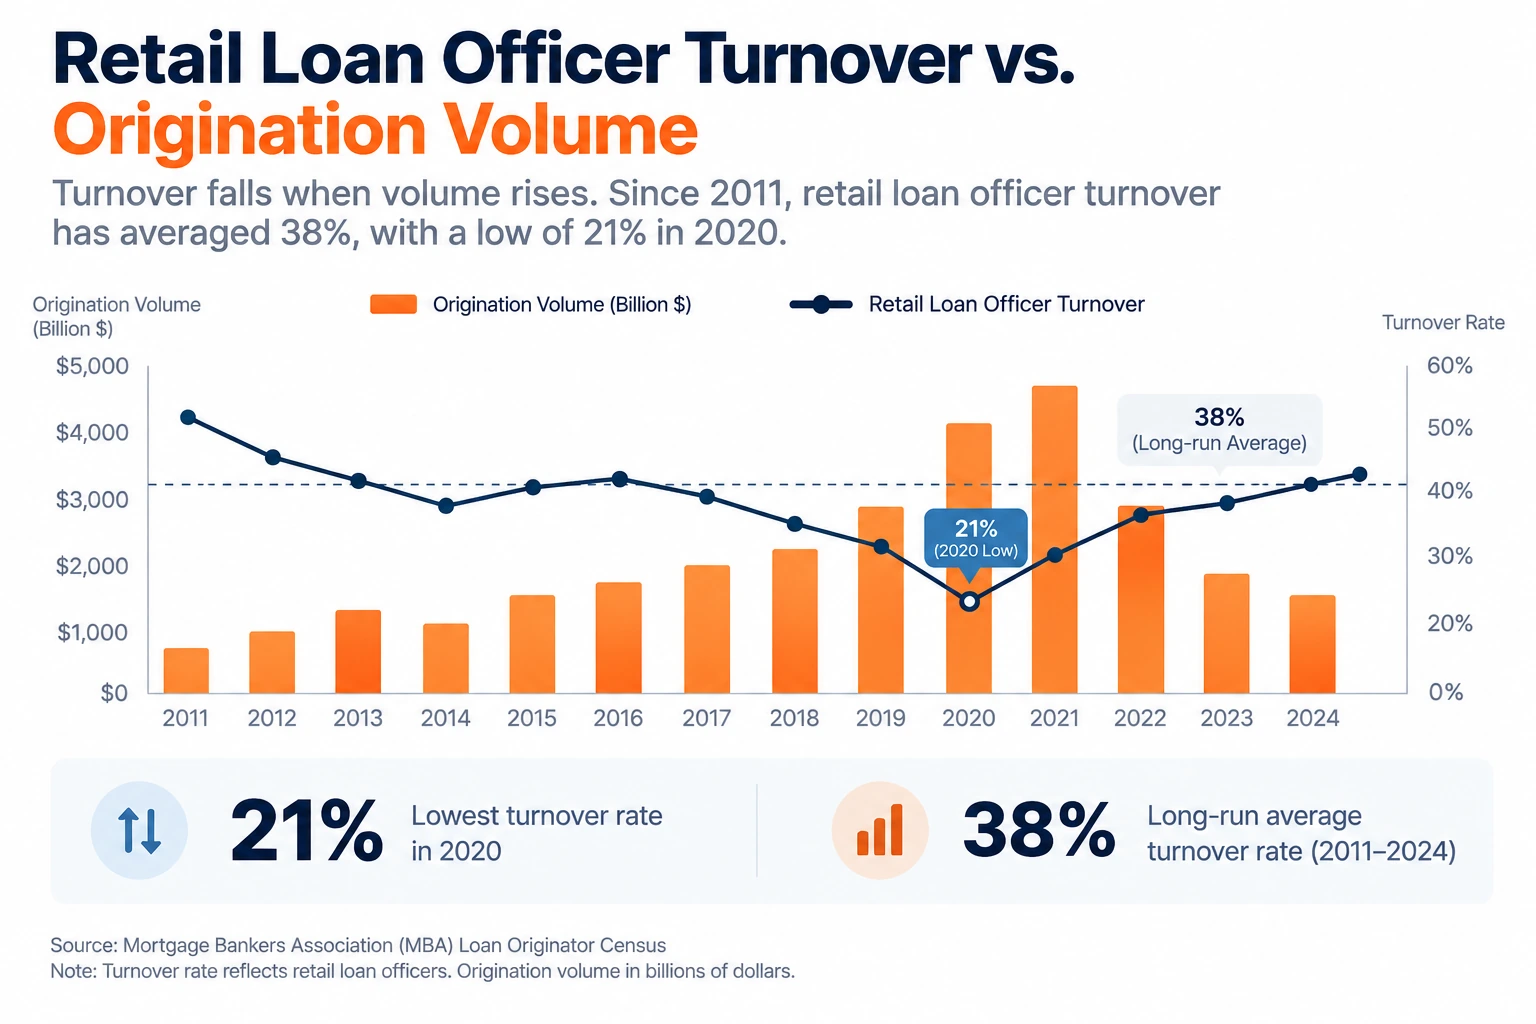
The 2007 peak was 51%. Independents hit 77% that year. Banks averaged roughly 13 points below independents across the period and never crossed 50%.
Note how that figure is built, because most quoted turnover numbers do not say. MBA counts voluntary and involuntary terminations for the year. Then divides by the average number of retail loan officers employed over that year. The 2020 data covers 103 firms.
STRATMOR separately puts typical annual turnover in the 30 to 40% range, with average tenure of three to four years.
Read the pattern rather than the number. Turnover falls when volume is high, because officers who are doing well do not move. It rises when volume falls. A manager comparing their branch to an industry average is measuring against a moving target. That figure tracks the market, not management quality.
What that means practically: your turnover number tells you less than the timing of it. An officer leaving in a good market is a management signal. An officer leaving in a bad one is often leaving the business altogether.
And the exit itself is a separate problem. An officer who leaves with the relationships is a different loss from one who leaves with the records. The second is preventable and most branches find out it was not prevented after the fact.
Where Coaching Fits
At some point the answer is outside help, from a coach or from mortgage sales training programs built for teams.
The boundary is worth being clear about. A manager who cannot see activity does not have a coaching problem. They have a data problem, and coaching will produce good conversations about numbers nobody trusts.
Fix visibility first. Then a coach has something to work with, and so do you.
One more thing about coaching in this business. Most of it is aimed at the loan officer rather than the manager. Programs teach production habits, and production habits are what an officer needs. How to manage loan officers is a different skill and a thinner market.
We reviewed the programs in top mortgage coaching programs.
The Part That Is Actually About Software
Everything above assumes you can see the activity. Most branches cannot, and that is not a discipline failure.
Attempts live in an officer’s head. Calls happen on a cell phone that logs nothing. The pipeline is a spreadsheet somebody updates on Fridays. No management technique works on top of that. You are managing a report rather than a team.
Four things a system has to produce for any of this to work. Attempts per opportunity by officer. Time to first contact by source. Activity visible without asking. And a record of what was said, not only that something happened.
That is what mortgage pipeline management software is for, and it is the difference between managing behavior and reviewing history.
Frequently Asked Questions
What should a branch manager measure weekly?+
Three leading indicators, not eleven. Attempts per opportunity, time to first contact, and contact rate are the usual three. They move before production does and they reflect behavior rather than market conditions.
Pick three, pull them from the system rather than from the officer, and review them every week.
How do you hold loan officers accountable without micromanaging?+
Hold them to activity they control rather than outcomes they do not. Nobody controls whether a borrower answers. Everybody controls whether they dialed.
That distinction only works if you can see the activity without asking. A manager who has to ask is either hovering or guessing.
What is a normal loan officer turnover rate?+
MBA and STRATMOR data puts the 2002 to 2020 average at 38%, with a survey low of 21% in 2020. STRATMOR describes typical annual turnover as 30 to 40% with average tenure of three to four years.
The pattern matters more than the number. Turnover falls in high-volume years and rises when volume drops. An average is a moving target rather than a benchmark.
How long should it take a new loan officer to ramp?+
Expect activity at thirty days, applications at sixty, and closings in the pipeline at ninety. An officer with no activity at thirty days is not ramping slowly.
Ramp is mostly set in week one. Officers who establish an activity habit early keep it. Officers who spend week one on paperwork tend to spend month three the same way.