Mortgage CRM Statistics 2026
You can find hundreds of mortgage CRM statistics online today. Most trace back to nothing. Here are the ones that hold up, and the ones nobody has measured.
The numbers that matter most
- 77% of borrowers apply to only one lender. More than 30% never comparison shop at all.
- 56% of inbound calls reach a person. Answer rate is a different problem from response time.
- 68% of lenders use AI to classify documents. Adoption started in sales and borrower contact, not underwriting.
- 32% of refinancing borrowers were retained in Q1 2026, down from a Q4 peak of 35%.
- TCPA suits are up 34.3% year to date, and 76.4% of June filings were putative class actions.
- March 4 2026: the Homebuyers Privacy Protection Act took effect, closing most mortgage trigger leads.
How many lenders a borrower actually talks to
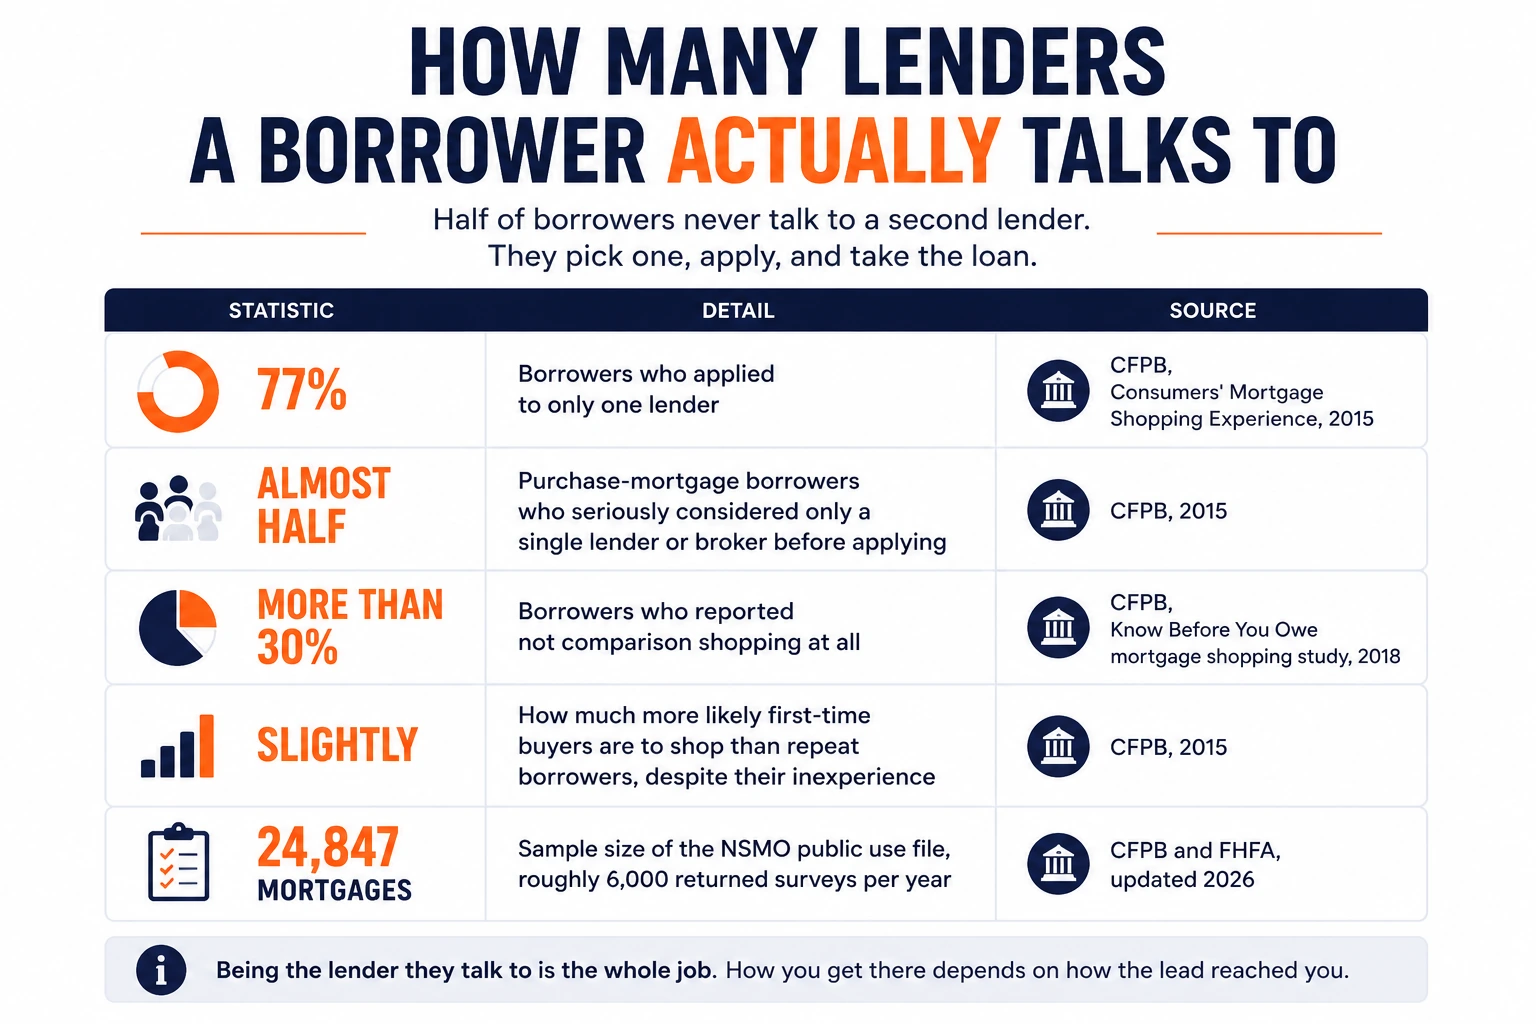
Half of borrowers never seriously consider a second lender. Most apply to one and take that loan.
That does not prove the first lender to call wins. No study shows that. What it shows is that the consideration set is narrow. The first real conversation carries more weight than it would in a market where borrowers shop four lenders.
Getting into that conversation is what the rest of this page is about.
What this data measures: how many lenders a borrower considered or applied to. Federal survey research, mortgage-specific.
| Statistic | Detail | Source |
|---|---|---|
| 77% | Borrowers who applied to only one lender | CFPB, Consumers’ Mortgage Shopping Experience, 2015 |
| Almost half | Purchase-mortgage borrowers who seriously considered only a single lender or broker before applying | CFPB, 2015 |
| More than 30% | Borrowers who reported not comparison shopping at all | CFPB, Know Before You Owe study, 2018 |
| One third | Recent homebuyers who obtained only one mortgage quote. Held steady across eight years of surveys | Fannie Mae National Housing Survey, 2014 to 2022 |
These numbers are old. They are also stable.
The CFPB research is from 2015 and 2018, and that is the newest federal work on borrower shopping behavior. Fair to ask whether it still holds.
Fannie Mae has asked the same shopping questions since 2014 and revisited them with the Q1 2022 survey. One third of recent homebuyers obtained a single quote, and the behavior did not move across the whole period. Two independent surveys, eight years apart, describing the same thing.
The two figures measure different steps and should not match. Fannie counts quotes obtained. CFPB counts applications submitted. A borrower can pull three quotes and apply to one.
Nothing newer than 2022 exists on mortgage shopping behavior. The NSMO public use file now runs through 2021 and nobody has published a shopping analysis from it.
How you get into that conversation depends on how the lead reached you.
Speed matters differently depending on where the lead came from
Most articles treat speed to lead as one rule for every lead. It is not. There are three modes and they behave differently.
A shopped lead. Five lenders got the same form. Every number in the next section applies here, and nowhere else on this list.
A referral. Someone the borrower trusts already vouched for you. They are not shopping and they will wait. Speed is courtesy, not competition. What loses a referral is never following up at all, not following up in an hour.
An inbound call. They are on the line right now. There is no response window. The call is answered or it is lost.
Sort your follow-up by these three and you stop spending urgency where it does not buy anything.
Getting the lead in the first place is a different job. We cover it in mortgage lead generation strategies.
What these numbers actually measure
The studies below measure different things and get quoted as if they measure the same thing. Worth thirty seconds before the tables.
| Term | What it means | What it is not |
|---|---|---|
| First response time | Time from lead created to first outbound attempt | Contact rate |
| Contact rate | Share of leads reached in a live two-way conversation | Qualification rate |
| Qualification rate | Share that meet criteria or have a real conversation | Funded-loan rate |
| Answer rate | Share of inbound calls picked up by a person | Response time |
| Funded-loan rate | Share that close and fund | Any of the above |
Two examples of why this matters. The 100x figure below is about making contact. The 21x figure is about qualifying. Neither is about funding a loan, and both get quoted as if they were.
Nothing on this page measures funded-loan conversion by response time. Nobody has published it.
Speed to lead on shopped leads
Everything below applies to leads the borrower shopped. Forms, lead vendors, comparison sites. Anywhere five lenders got the same record.
What this data measures: contact and qualification rates, cross-industry, not mortgage.
Most originators think they respond fast on these. Across every benchmark that exists, almost nobody does.
This is not a coaching problem. It is a routing and automation problem, and you can measure it.
| Statistic | Detail | Source |
|---|---|---|
| 23% | Firms that never responded to a test lead at all, out of 2,241 audited | HBR, 2011 |
| 37% | Firms that responded within the first hour | HBR, 2011 |
| 7x | Call in the first hour instead of waiting even one additional hour and you are 7 times more likely to qualify the lead | HBR, 2011 |
| 60x | Call in the first hour instead of waiting a full day and it is more than 60 times | HBR, 2011 |
| 100x | Call at five minutes instead of thirty and you are 100 times more likely to reach the person at all | Oldroyd & InsideSales, 2007 |
| 21x | At those same five minutes, you are 21 times more likely to qualify them | Oldroyd & InsideSales, 2007 |
Read the first two rows against the next two. Only 37% of firms made it inside the first hour. That first hour is worth 7 times the odds of qualifying against waiting even one more.
Reaching someone and qualifying them are also two different wins. That is why there are two numbers for the same five minutes.
That audit was 2011. Nobody has run it again.
Inbound calls: an availability problem, not a speed problem
An inbound call is the clearest signal of intent you get. Someone stopped what they were doing and dialed you.
There is no response window here. The call is answered or it is gone.
What this data measures: answer and in-call conversion rates across ten industries. Invoca does not break out mortgage.
Most never get picked up. Of the ones that do, most end without anyone asking for the business.
That is money you already paid for, walking away at the last step.
| Statistic | Detail | Source |
|---|---|---|
| 56% | Calls to businesses that reach a person | Invoca, 2026 |
| 65% | Answer rate for calls lasting more than 15 seconds, which filters out misdials and quick hangups | Invoca, 2026 |
| 71% | Answer rate for calls lasting more than 30 seconds | Invoca, 2026 |
| 38% | Answered calls that turn out to be real leads | Invoca, 2026 |
| 42% of leads | Answered-call leads that convert during the call itself | Invoca, 2026 |
| 64% | Businesses that never ask the caller to buy or book an appointment | Invoca, 2026 |
Roughly 44% of all inbound calls never reach a person. Filter down to callers who clearly meant it, and about 29% still do not get through.
And two thirds of the businesses that do answer never ask for the business.
What a missed call actually costs
You will see dollar figures for this online. Almost all come from answering services selling the answer. Run the benchmark chain against your own numbers instead.
Run Invoca’s all-industry averages against 100 calls. About 56 get picked up, 21 of those are classified as leads, and 9 convert during the call.
That is a call-center illustration, not a mortgage funded-loan benchmark. Use the structure, not the numbers, and run your own.
Invoca puts the upside this way. Improve your answer rate, lead rate, and conversion rate by five points each. You get about 40% more conversions from the same call volume.
The after-hours gap nobody has measured
Every benchmark above is an all-hours average dominated by business-hours performance. Answer rates after hours and on weekends are substantially worse. Anyone who has run a call floor knows the drop is steep.
Nobody has published that figure for mortgage. We are not going to estimate it.
What we can say is simple. Borrower calls do not stop at 6pm, and the marketing that drives them runs all night. A missed after-hours call is not a slow response. It is a lost call. That gap is the biggest blind spot in mortgage lead handling, and nobody has measured how wide it is.
That is the case for answering around the clock, and it does not require a made-up statistic to make it.
CRM and technology adoption
AI arrived in mortgage through sales and borrower contact first, not underwriting. That is your side of the business.
STRATMOR reports most lenders are still experimenting rather than running a defined AI strategy. The gap between shops that figure this out and shops that do not is about to get wide.
| Statistic | Detail | Source |
|---|---|---|
| 68% | Lenders using AI to classify and index documents | STRATMOR TIS, 2025 results, US lenders |
| 59% | Lenders using AI to read documents | STRATMOR, 2025 results |
| ~50% | Lenders using AI to analyze borrower income during underwriting | STRATMOR, 2025 results |
| 63% / 17% | AI-using lenders going through a third-party vendor, versus using AI built into the LOS | STRATMOR, 2025 |
| 15% → 38% | AI and machine learning adoption among lenders, 2023 to 2024 | STRATMOR, 2025 |
| 30% → 48% | Robotic process automation adoption, 2020 to 2024 | STRATMOR, 2024 |
| ~80% | Lenders with a company-sponsored CRM or lead management tool. Most recent public lender-level figure | STRATMOR, 2019, US lenders |
Nobody has published current numbers on how many lenders use a CRM since 2019. That gap is seven years old.
If you are still choosing a platform, we cover the top mortgage CRMs for loan officers compared separately.
None of this helps if your systems do not talk to each other. Document AI is worth little if the data stops before it reaches your LOS. See how the major loan origination systems compare.
Database management and past client retention
Two out of three refinancing borrowers go to a different servicer. That has been true for fifteen years.
What this data measures: whether a borrower refinances with the same servicer. Not whether they come back to the same loan officer. Nobody measures that.
Read as directional. Your best year is the first one after closing, and your odds fall from there.
A CRM either handles this part of the business or it does not. It is also the easiest thing on this page to measure.
Speed is not the lever here. Consistency is. A past client does not care whether you called back in an hour. They care whether you were still there in year three.
Building that schedule is its own discipline. The loan officer marketing playbook covers it.
| Statistic | Detail | Source |
|---|---|---|
| ~30% | Average servicer retention of refinancing borrowers since Q2 2010 | ICE Mortgage Technology, McDash, 2025 |
| Peaks then declines | Retention peaks in the year following origination and gradually falls after that | ICE Mortgage Monitor, March 2026 |
| More than 50% | Retention on borrowers refinancing out of 2025 vintage loans in Q4 2025 | ICE Mortgage Monitor, March 2026 |
| 45%, down from 51% | Retention on 2024 vintage loans in Q4 2025 | ICE Mortgage Monitor, March 2026 |
| 42% | Retention across the 2022 to 2025 cohort, which drove roughly 70% of refinance activity | ICE Mortgage Monitor, March 2026 |
| 8 percentage points | How much higher recent early refinances retain compared with similar early refinances of 2015 to 2019 loans | ICE Mortgage Monitor, March 2026 |
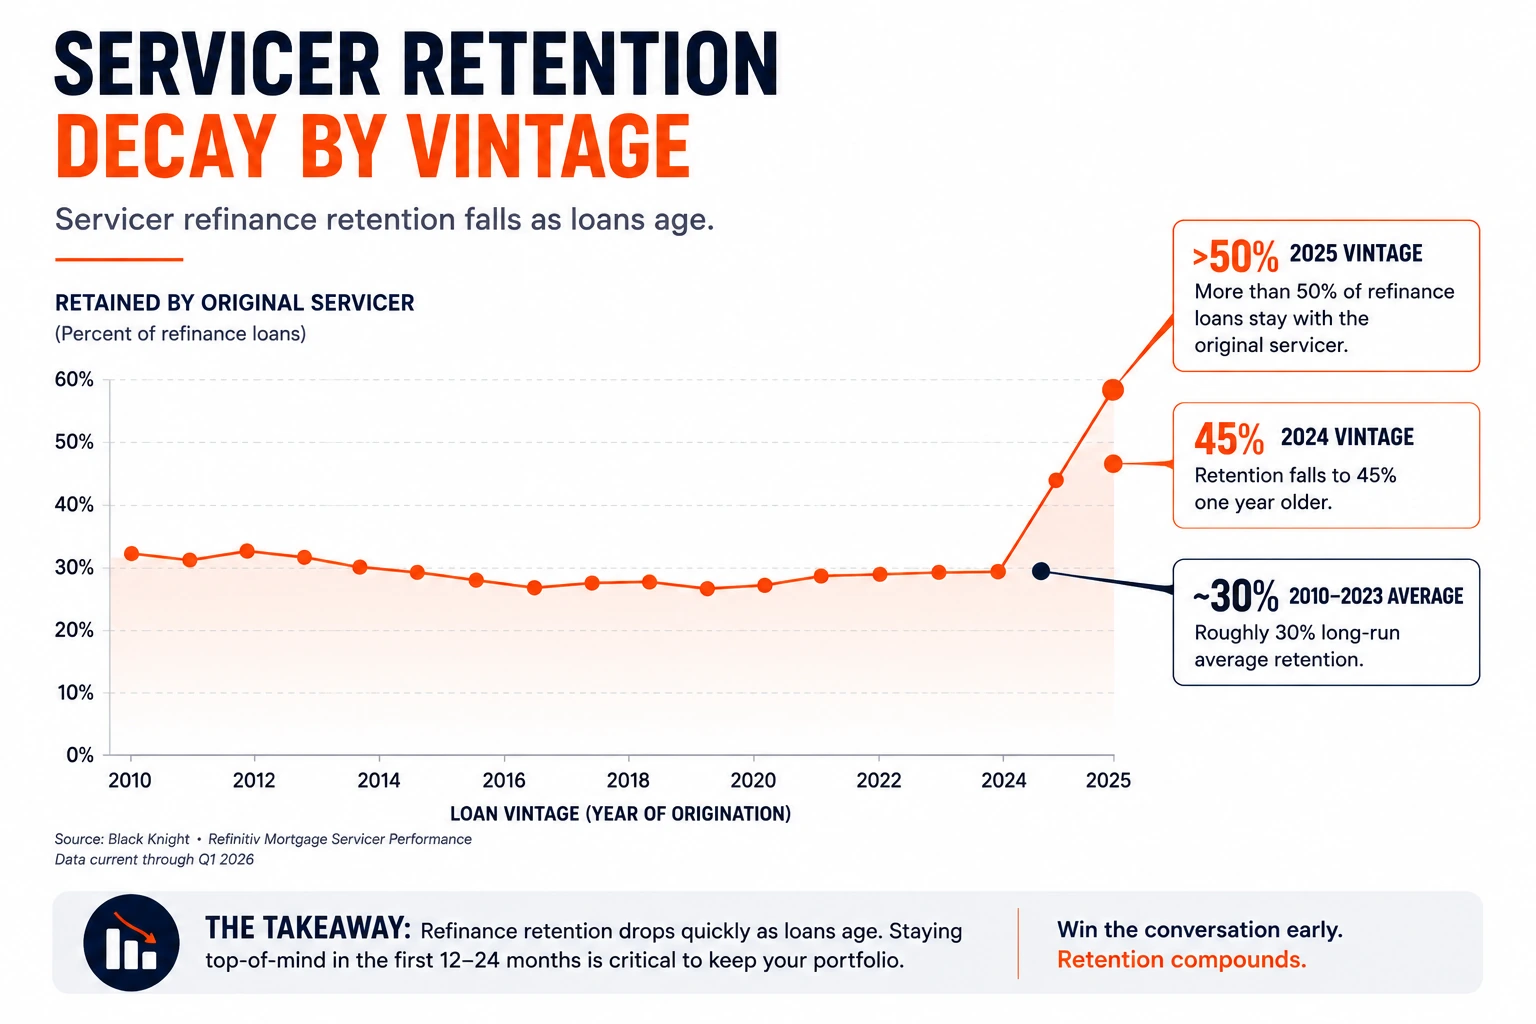
The first two rows are the case for staying in touch after closing. They come from a servicing data company, not a CRM vendor. If your follow-up starts at the one-year anniversary, you started late.
Who keeps borrowers, and who loses them
| Statistic | Detail | Source |
|---|---|---|
| 35% | Retention at nonbank servicers | ICE Mortgage Monitor, December 2025 |
| 13% | Retention at banks, roughly a third of the nonbank rate | ICE Mortgage Monitor, December 2025 |
| 36% | Retention on FHA and VA loans, the best of any investor type | ICE Mortgage Monitor, December 2025 |
| 25% | Retention on GSE loans | ICE Mortgage Monitor, December 2025 |
| 23% | Retention on portfolio-held loans | ICE Mortgage Monitor, December 2025 |
| 6% | Retention on privately securitized loans, the worst of any investor type | ICE Mortgage Monitor, December 2025 |
| 14-point gap | Rate refinances retain at 37%. Cash-out refinances retain at 23% | ICE Mortgage Monitor, December 2025 |
| Peaked at 35% | Retention ran 25%, 23%, then 28% through 2025, hit 35% in Q4, the highest since early 2014, then fell back to 32% | ICE Mortgage Monitor, 2026 |
| 32% | Q1 2026 retention, down from 35% the prior quarter, even as refinance volume hit a four-year high | ICE Mortgage Monitor, May 2026 |
| 37% | Q1 2026 rate-and-term retention, down from 42% | ICE Mortgage Monitor, May 2026 |
FHA and VA loans hold six times better than privately securitized loans. That is the widest gap on the list. Cash-out borrowers are the hardest to keep. When someone refinances for a lower rate, you can see it coming in the data. When they want cash, you cannot.
ICE says the answer is better targeting, not more marketing. Their August 2025 report points to two things. Connecting your lending and servicing systems, and knowing which borrowers are refinancing and why.
What nobody has measured
Nobody has published real numbers on how fast a mortgage database goes stale. Same for whether post-close follow-up works, and for repeat business rates at the loan officer level. Nobody has published current follow-up cadence data for consumer lending either. Not the number of touches, not the channel mix, not the timing.
The numbers you see quoted on those topics come from nowhere.
ICE measures retention at the servicer. Nobody measures it at the loan officer.
Market context
Short on purpose. These set the backdrop. None of them is a CRM number.
| Statistic | Detail | Source |
|---|---|---|
| $2.147 trillion | Total 1-4 family origination forecast for 2026, revised down from $2.163T in July | MBA, August 21 2026 |
| $713 billion | 2026 refinance forecast, cut roughly 5% from the prior estimate | MBA, August 2026 |
| $973 per loan | Pre-tax net production profit, Q2 2026, up from $727 in Q1. Fifth straight profitable quarter | MBA, August 18 2026 |
| $10,936 per loan | Q2 2026 production expense, down from $11,898 in Q1 | MBA, August 2026 |
| $7,945 per loan | Average production expense from Q2 2008 through Q2 2026 | MBA, August 2026 |
| 85% | Firms posting pre-tax net financial profit, up from 76% in Q1 | MBA, August 2026 |
Anyone still quoting the October 2025 forecast of $2.2 trillion is a year behind. MBA surveyed 334 companies, 82% of them independent mortgage banks.
Compliance, 2025 to 2026
Three rules changed in the last eighteen months. Lawsuits are climbing.
| Statistic | Detail | Source |
|---|---|---|
| 1,532 suits | Federal TCPA lawsuits filed through June 2026, up 34.3% year to date against 2025 | WebRecon, 2026 |
| 76.4% | Share of June 2026 TCPA filings that were putative class actions, up from 72.3% in February | WebRecon, 2026 |
| ~40% | June 2026 consumer protection plaintiffs who had filed a similar action before | WebRecon, 2026 |
| $500 to $1,500 | TCPA statutory damages per call or text, trebled for willful violations | 47 U.S.C. § 227 |
| March 4 2026 | HPPA effective date. Public Law 119-36 amends FCRA Section 604(c) and closes most mortgage trigger leads | Congress.gov, 2026 |
| January 24 2025 | The Eleventh Circuit vacated the FCC one-to-one consent rule in Insurance Marketing Coalition v. FCC, three days before it took effect. The underlying consent obligation survived | Eleventh Circuit, 2025 |
| State-level | NMLS ID display requirements in advertising are set by states, not federal rule | NMLS |
Frequently asked questions
How many lenders does a mortgage borrower actually shop?+
Most shop one. CFPB research found 77% of borrowers applied to only one lender. Almost half seriously considered just one lender or broker. More than 30% reported no comparison shopping at all. Fannie Mae has tracked the same behavior since 2014. One third of recent homebuyers obtained a single quote, unchanged through 2022.
Being first does not guarantee the business. No study establishes that. What it establishes is a narrow field, which makes the first real conversation count for more.
How fast should you respond to a mortgage lead?+
Immediately on purchased leads. Inside the first hour on everything else. Referrals will wait. No study establishes any of this for mortgage, so treat these as operating standards rather than benchmarks.
Cross-industry research shows the first hour is worth 7 times the odds of qualifying a lead. Against a full day, 60 times. At five minutes instead of thirty, reaching the person at all is 100 times more likely.
Purchased leads are the hard case. Four or five lenders buy the same record simultaneously. No human wins that race, which is why first contact has to be automated.
What percentage of inbound calls go unanswered?+
About 44%, across ten industries. Invoca tracked 70 million calls and found 56% reach a person. Filtering to calls over 30 seconds, which removes misdials, 71% get answered. Nobody publishes a mortgage-specific answer rate, and nobody has measured after-hours performance, which is substantially worse.
Answer rate is a different problem from response time. Nobody is waiting on a callback. Either someone picks up or you lost the lead.
Do borrowers refinance with the same lender?+
Usually not. ICE data shows servicers have retained roughly 30% of refinancing borrowers since 2010. Retention peaked at 35% in Q4 2025, then fell to 32% in Q1 2026. Refinance volume hit a four-year high in that same quarter.
Retention varies more by who holds the loan than by anything a loan officer does. Nonbanks retain 35% against 13% at banks. FHA and VA loans retain at 36% against 6% for privately securitized loans.
One caveat that matters. These figures measure whether a borrower refinances with the same servicer. They do not measure whether the borrower comes back to the same loan officer. Nobody measures that.
What mortgage CRM data does not exist?+
Five things, and every one of them gets quoted anyway with no study behind it. These are the mortgage CRM measurements nobody has published.
• Time to first contact on mortgage leads, and funded-loan conversion by response-time band
• After-hours and weekend answer rates
• How fast a mortgage database goes stale
• Whether post-close follow-up changes repeat business
• Follow-up cadence for consumer lending: touch counts, channel mix, timing
Public research on borrower shopping behavior also stops in 2022. The CFPB survey file that could refresh it has never been analyzed for this question.
Methodology
Every number on this page comes from a third party. None of it is ours. Every figure shows its source and its year. When the best available number is older than 2023, we print the year instead of hiding it. Old stats with the dates stripped off are how bad data spreads.
Two studies get confused constantly, so here is which is which. The 21x and 100x figures did not come from MIT. The researcher worked at MIT Sloan, but the study was vendor data presented at a sales conference in 2007. The 2011 Harvard Business Review article is the reviewed one. It audited 2,241 US firms with test leads. The 23%, 37%, 7x, and 60x numbers all trace to that audit.
ICE retention data comes from its McDash database of roughly 35 million loans matched anonymously to public records. Invoca’s figures come from 70 million calls and 600 million conversation minutes across ten industries.
Three numbers you will find on almost every other page are missing here on purpose. Nobody can point to a study behind the claim that 78% of borrowers go with the first lender who responds. The 391% one-minute conversion lift is quoted four different ways, with no agreement on the comparison. And the 98% SMS open rate counts lock-screen previews, not reads.
This page is refreshed against five publication calendars:
- MBA quarterly performance report
- MBA monthly origination forecast
- ICE Mortgage Monitor
- WebRecon monthly litigation data
- STRATMOR annual Technology Insight Study